前言
通过上篇【Canvas 绘制 2D 图形】 我们知道了如何绘制简单的 Canvas,在需求场景中我们往往也需要在 Canvas 中绘制 GeoJSON (具体见 GeoJSON 是什么? )数据的缩略图。下面以中国地图为例,绘制一个地图缩略图。
GeoJSON几何类型包括:
Point // 点MultiPoint // 多个点LineString // 线MultiLineString // 多条线Polygon // 多边形MultiPolygon // 多个多边形FeatureCollection // 特征集合,主要是上面几种类型的集合,并且支持无限嵌套。
在本例子中我们需要用到这份数据 https://cdn.emooa.com/geojson/100000.json,集合类型为 MultiPolygon,部分数据如下:
1
2
3
4
5
6
7
8
9
10
11
12
13
14
15
16
17
18
19
20
21
22
23
24
25
26
27
28
29
30
| [
{
"type": "MultiPolygon",
"coordinates": [
[
[
[112.716779, 32.357793],
[112.719173, 32.361766],
[112.729295, 32.366112],
[112.733577, 32.366214],
[112.734229, 32.363641],
[112.736267, 32.358329],
[112.735864, 32.35633],
[112.734111, 32.356769],
[112.735005, 32.357939],
[112.734544, 32.358915],
[112.732323, 32.360444],
[112.732072, 32.362762],
[112.730898, 32.363121],
[112.725303, 32.361941],
[112.723034, 32.360968],
[112.724092, 32.358475],
[112.716779, 32.357793]
]
],
],
...
},
...
]
|
数据格式为 EPSG:4326 的 MultiPolygon。这份数据的每一项都是由经纬度组成的,且第一个点和最后一个点相同,意味着图形是闭合的三维数组,
定义 Canvas
创建元素
1
| <canvas id="emooa-canvas" width="400" height="400"></canvas>
|
获取上下文
要在 Canvas 上绘制图形,您需要获取 Canvas 的 2D 上下文。在 JavaScript 中,使用以下代码获取 Canvas 上下文:
1
2
3
| const canvas = document.getElementById("emooa-canvas");
const ctx = canvas.getctx("2d");
|
获取 Canvas 的实际显示大小
1
2
| const displayWidth = canvas.clientWidth;
const displayHeight = canvas.clientHeight;
|
将 Canvas 的分辨率设置为实际显示大小
这一步,可以有效的解决由于 Canvas 的分辨率与显示大小不匹配所致的绘制图形模糊不清的问题。
1
2
| canvas.width = displayWidth;
canvas.height = displayHeight;
|
数据处理
将经度和纬度单独拆分出来
1
2
3
4
5
6
7
8
9
10
11
12
13
14
15
16
17
18
19
20
21
22
23
24
25
26
27
28
29
30
| const longitudes = [].concat(
...[].concat(
...data.map((item) => {
const coordinates = item.coordinates || [];
switch (item.type) {
case "MultiPolygon":
return [].concat(
...coordinates.map((coordinate) =>
coordinate.map((coord) => coord.map((c) => c[0]))
)
);
}
})
)
);
const latitudes = [].concat(
...[].concat(
...data.map((item) => {
const coordinates = item.coordinates || [];
switch (item.type) {
case "MultiPolygon":
return [].concat(
...coordinates.map((coordinate) =>
coordinate.map((coord) => coord.map((c) => c[1]))
)
);
}
})
)
);
|
得到的结果一份拆分之后包含所有数据的一维数组:
1
2
| const longitudes = [ 112.716779, 112.729295, ..., 127.034099 ];
const latitudes = [ 32.357793, 32.361766, ..., 41.743216 ];
|
获取经纬度的极大值、极小值
1
2
3
4
5
6
7
8
9
10
11
12
13
14
15
16
17
18
19
20
21
| const xMax = longitudes.reduce(function (max, current) {
return Math.max(max, current);
}, -Infinity); // 初始值设置为负无穷,以确保数组中的任何值都能成为最大值
const xMin = longitudes.reduce(function (min, current) {
return Math.min(min, current);
}, Infinity); // 初始值设置为正无穷,以确保数组中的任何值都能成为最小值
const yMax = latitudes.reduce(function (max, current) {
return Math.max(max, current);
}, -Infinity); // 初始值设置为负无穷,以确保数组中的任何值都能成为最大值
const yMin = latitudes.reduce(function (min, current) {
return Math.min(min, current);
}, Infinity); // 初始值设置为正无穷,以确保数组中的任何值都能成为最小值
本来想直接通过这段代码获取极值,但是因为数据量太大的原因导致栈溢出了。
// const xMax = Math.max(...longitudes);
// const xMin = Math.min(...longitudes);
// const yMax = Math.max(...latitudes);
// const yMin = Math.min(...latitudes);
|
计算缩放比例
总的缩放比例 scale 采用 xScale、yScale 谁小用谁。因为用小的缩放比例,才能在有限的空间下显示完全。
最后乘于 0.9 的倍数,是为了防止图形紧贴 canvas 的边缘,保留空白边框。
1
2
3
4
5
| const width = canvas.width;
const height = canvas.height;
const xScale = width / (xMax - xMin);
const yScale = height / (yMax - yMin);
const scale = (xScale < yScale ? xScale : yScale) * 0.9;
|
计算偏移度
Math.abs(xMax - xMin) * scale 作用是将经度按照 scale 进行缩放,纬度也是同理。再用 width 和 height 去减,分别得到要 x 轴和 y 轴需要偏移的空间
这些空间要分布在两边,也就是说要分布 MultiPolygon 的周围,所以左后需要除 2。
1
2
| const xoffset = (width - Math.abs(xMax - xMin) * scale) / 2;
const yoffset = (height - Math.abs(yMax - yMin) * scale) / 2;
|
缩放 Coordinates
- 将每个点的经度减去最小值,由于 地图的
Y 轴和屏幕的 Y 轴刚好相反,所以用最大值减去每个点的维度
- 乘于缩放比例
- 加上偏移量
1
2
3
4
5
6
7
8
9
10
11
12
13
14
| const coords = data.map((item) => ({
type: item.type,
coordinates: item.coordinates.map((coordinate, index) => {
switch (item.type) {
case "MultiPolygon":
return coordinate.map((coord) =>
coord.map((c) => [
(c[0] - xMin) * scale + xoffset,
(yMax - c[1]) * scale + yoffset,
])
);
}
}),
}));
|
开始绘制
1
2
3
4
5
6
7
8
9
10
11
12
13
14
15
16
17
18
19
| ctx.clearRect(0, 0, width, height);
coords.forEach((coord) => {
switch (coord.type) {
case "MultiPolygon":
coord.coordinates.forEach((c) => {
ctx.beginPath();
ctx.fillStyle = coord.fill;
ctx.strokeStyle = stroke;
ctx.fillOpacity = 0.2;
c[0].forEach((_c) => {
ctx.lineTo(_c[0], _c[1]);
});
ctx.closePath();
ctx.stroke();
ctx.fill();
});
break;
}
});
|
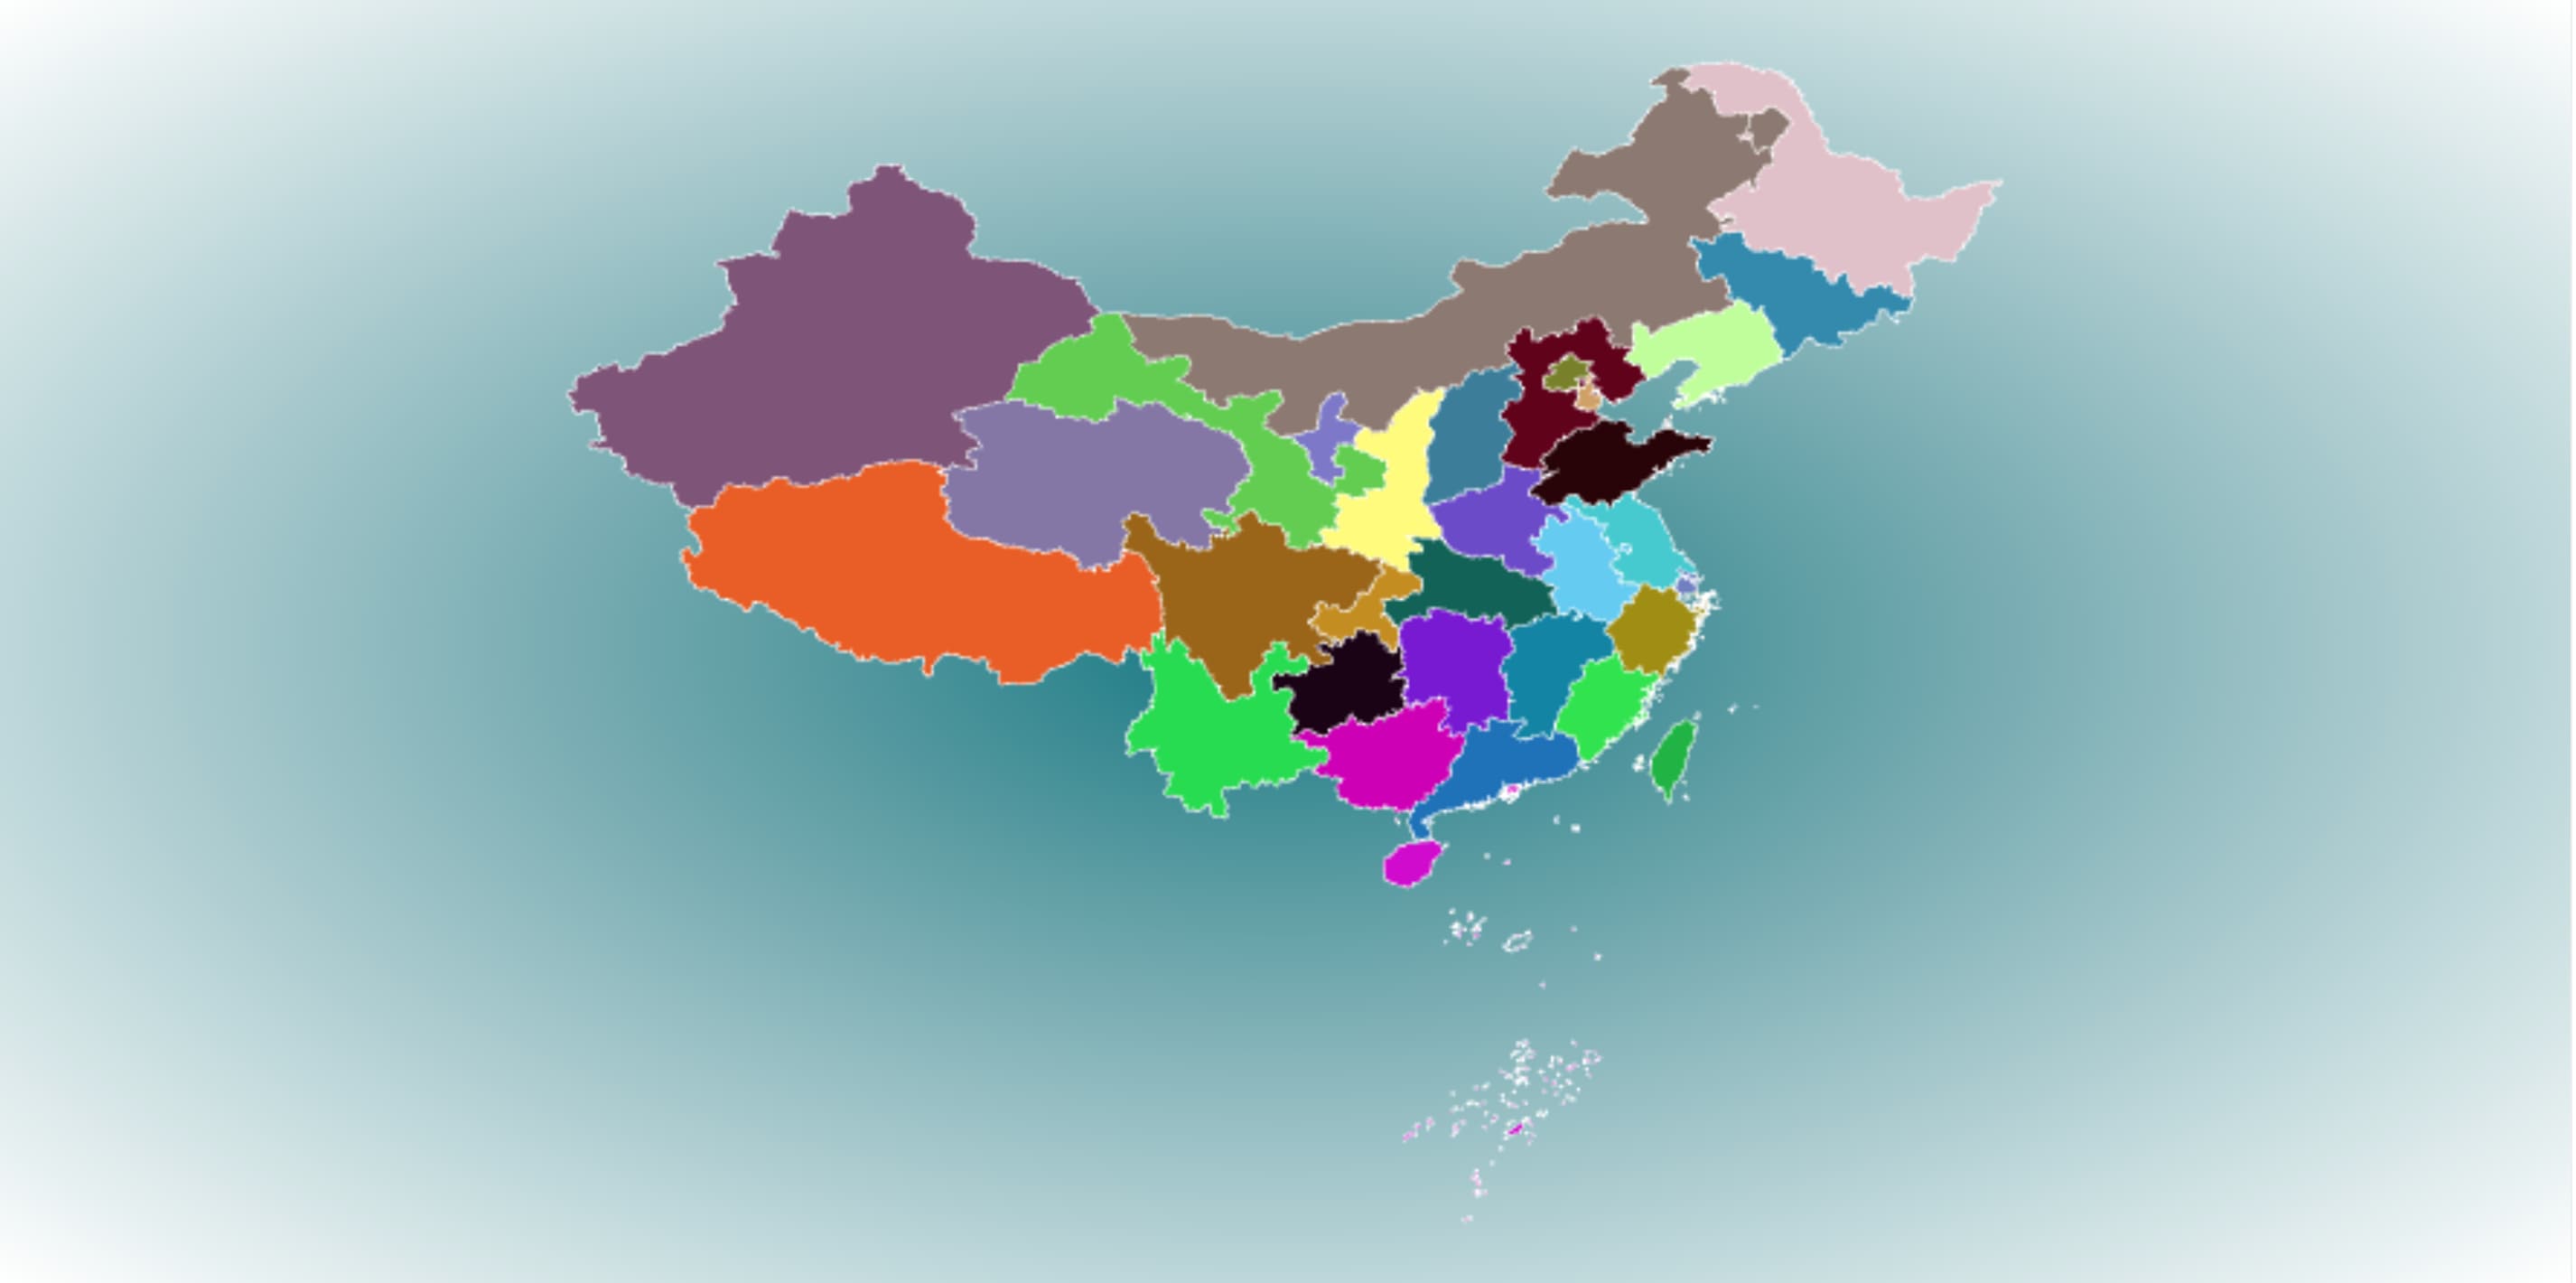
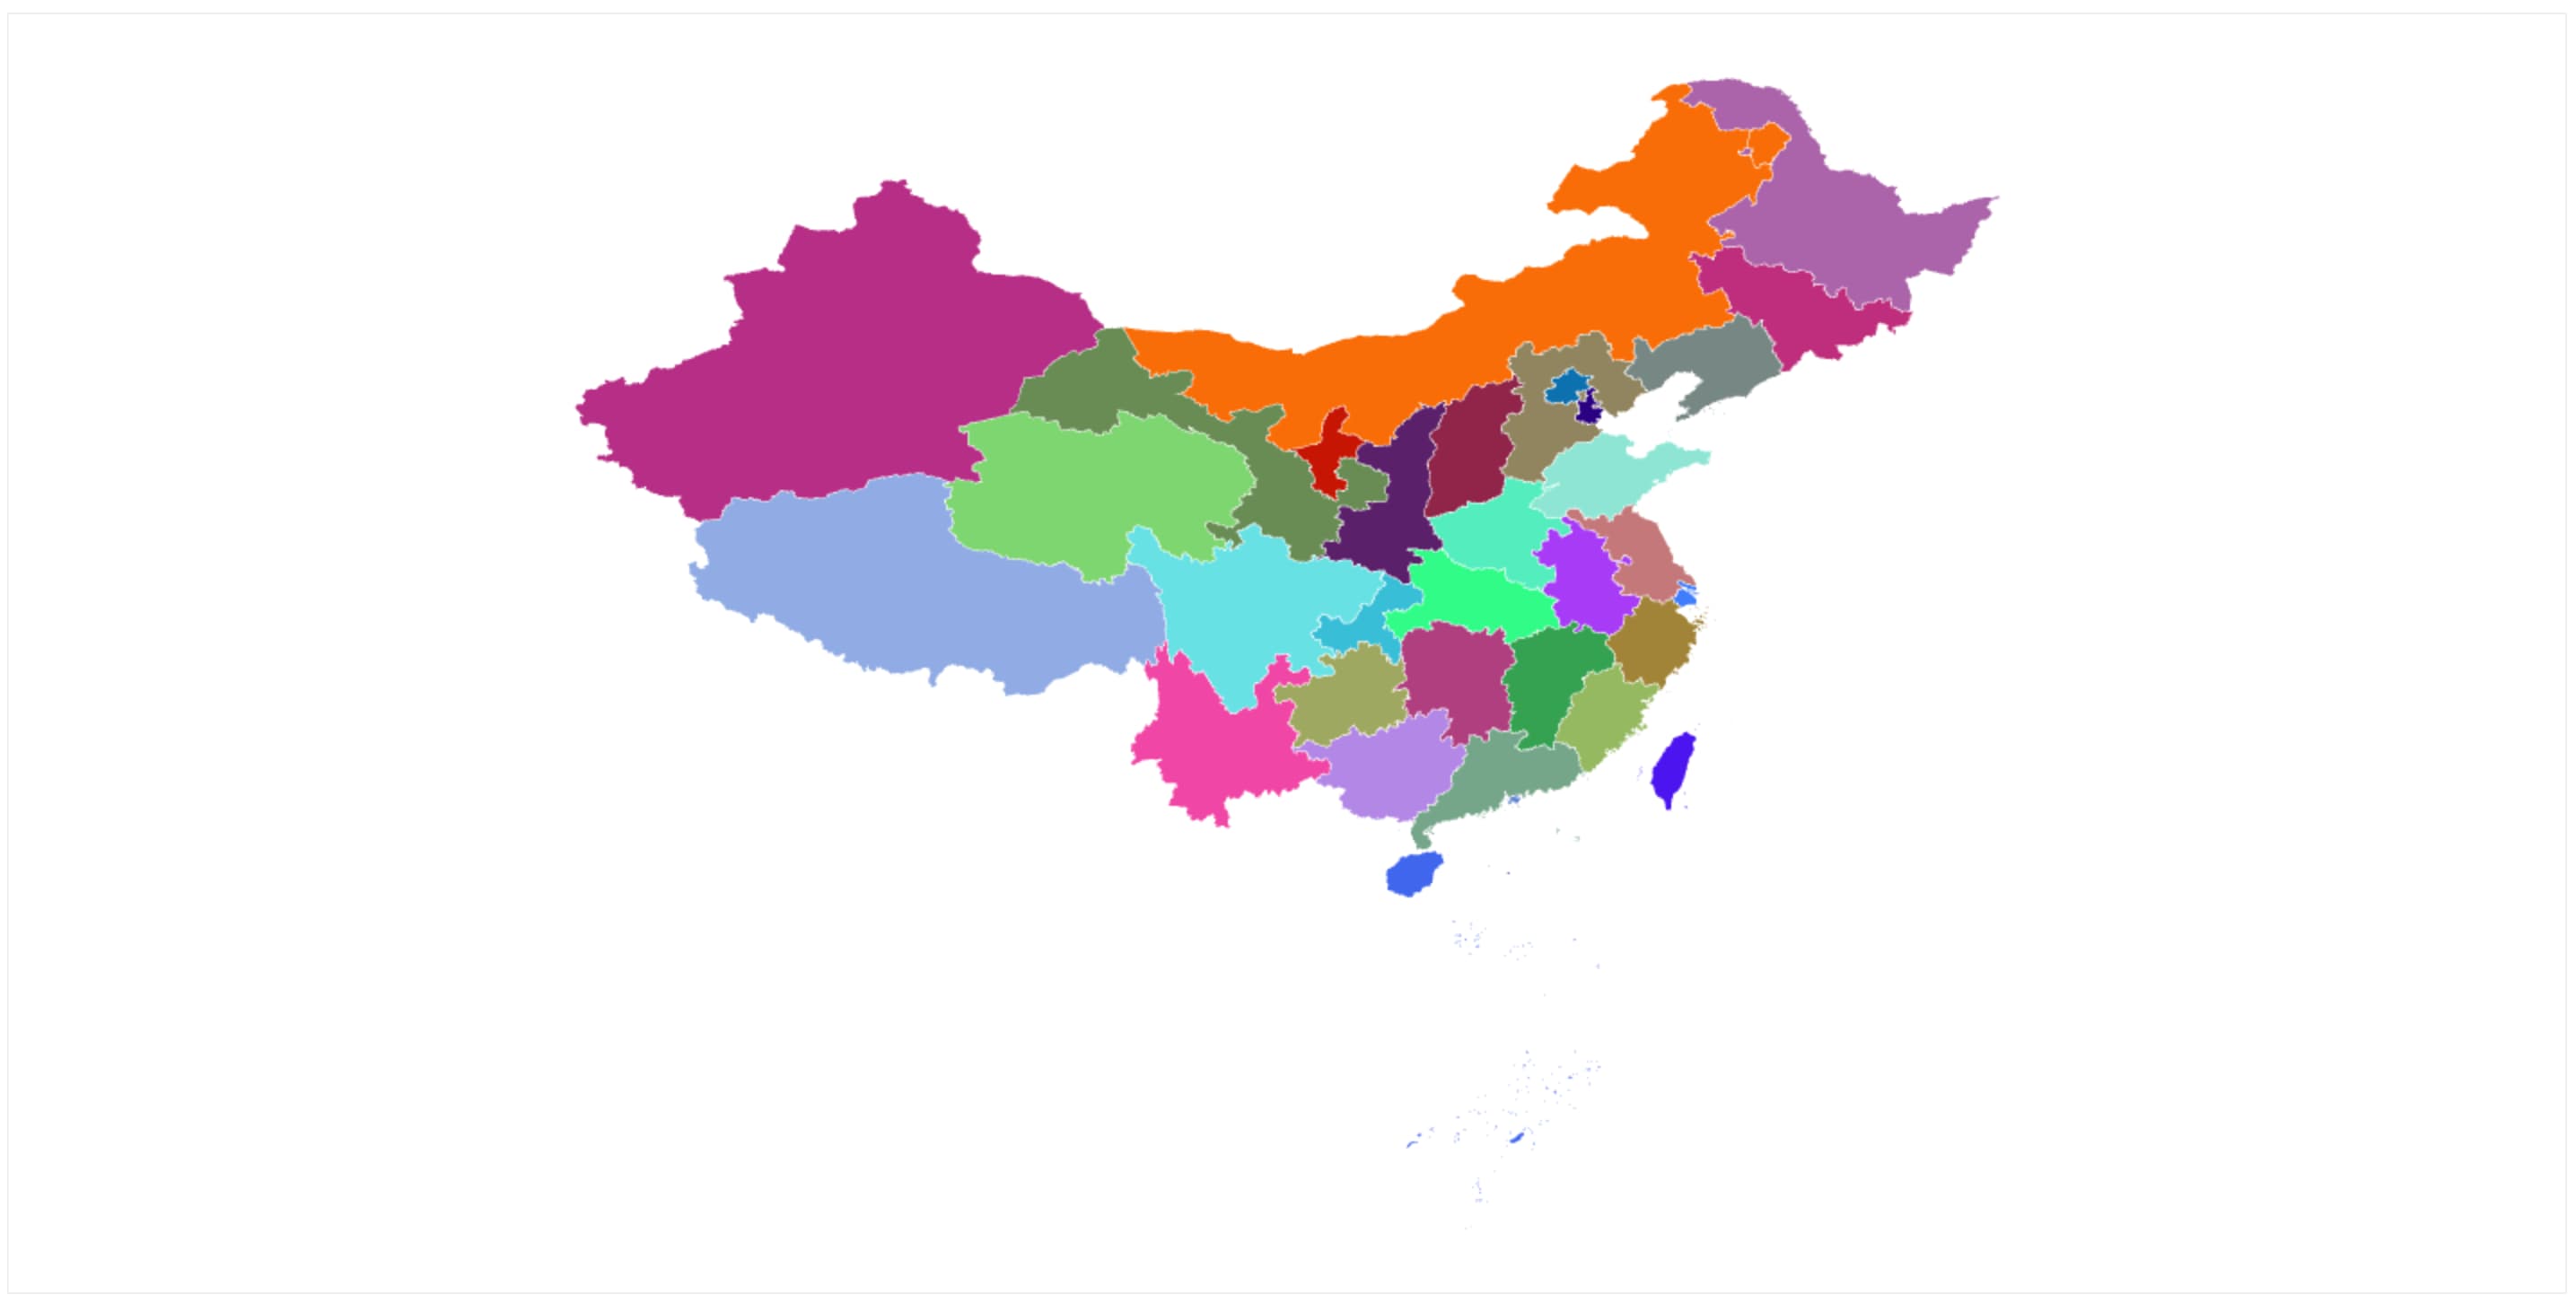
最终结果
完整代码
具体代码见 https://github.com/heiemooa/heiemooa/tree/demos/demos/canvas-geojson,满足 GeoJSON 的所有几何类型的同时渲染。